Organizations
Insights
Overview
Insights provide organization administrators with powerful analytics to track environment usage across their organization. This feature helps identify usage patterns, optimize cloud infrastructure costs, and monitor adoption across teams.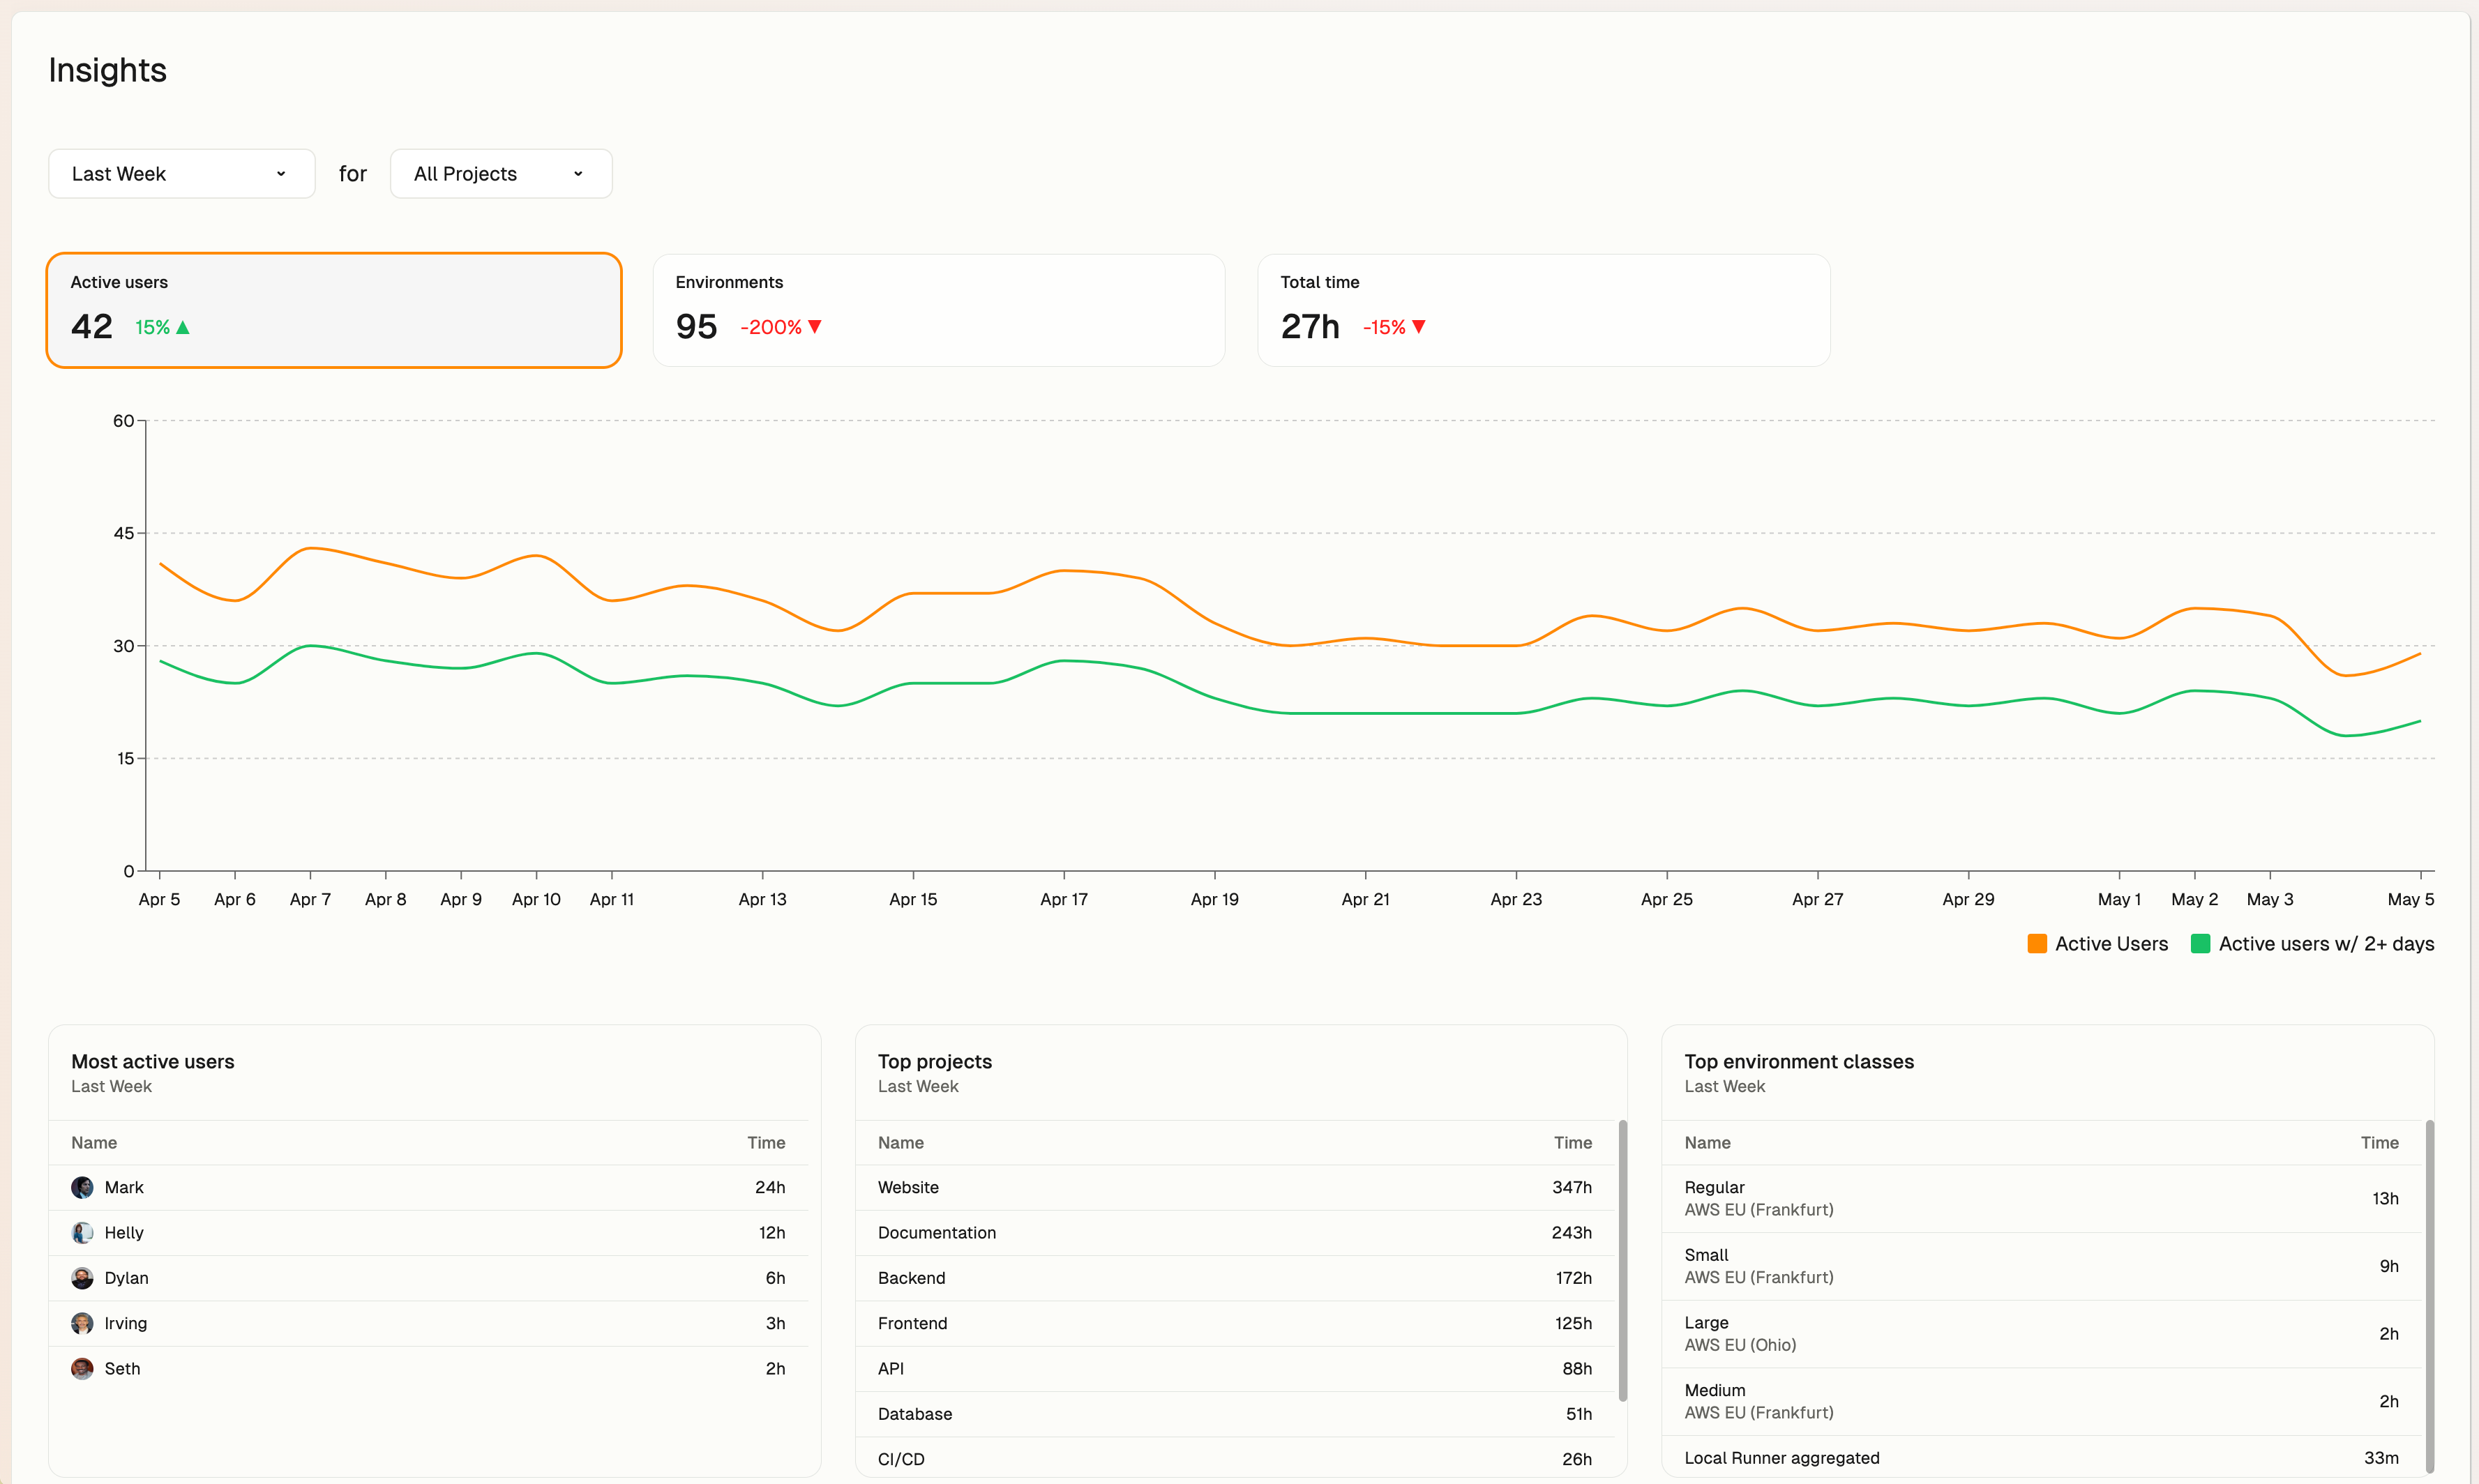
Insights
Key Benefits
- Usage Analysis: Track environment runtime hours across projects and users
- Cost Optimization: Identify opportunities to reduce cloud infrastructure expenses
- Adoption Monitoring: Measure user engagement and feature adoption
Accessing Insights
Insights are available to all administrator users of organizations on the Enterprise billing tier.- Navigate to https://app.gitpod.io
- Select Insights from the left navigation menu
Using the Insights Dashboard
Time Range Selection
The Insights dashboard allows you to select different time ranges to analyze your data:- Last Day
- Last Week
- Last 14 Days
- Last Month
- Last 6 Months
- Last Year
Available Metrics
The Insights dashboard provides several key metrics:Active Users
Shows the number of unique users who started at least one environment during the selected time period. Includes:- Weekly active users: Users with at least one started environment in the previous 7 days
- Weekly active users w/2+ days: Users with environments started on two or more different days in the past 7 days
The “Last Day” view is not available for weekly active user statistics, as
these metrics require daily aggregation.
Environments
Displays the total number of environments started during the selected period.Total Time
Shows the accumulated environment runtime hours for the selected period. Environment runtime is calculated from the time an environment was started until it finished stopping.Detailed Views
The dashboard includes three detailed sections:-
Most Active Users
- Lists users with the highest environment usage time
- Shows total runtime hours per user
-
Top Projects
- Ranks projects by total environment usage time
- Helps identify which projects consume the most resources
-
Top Environment Classes
- Displays resource consumption by environment class (Large, Regular, etc.)
- Helps identify optimal environment configurations for cost management
- Aggregates all local runners for easier comparison with shared remote runners
Frequently Asked Questions
Will I be able to view data from before I upgraded my organization to Enterprise?
Yes, you will be able to view all environment usage data after May 16, 2025, regardless of what tier your organization was on before you upgraded.Does this include my deleted environments?
Yes, environment usage data is unaffected by changes made to their corresponding environments. Data for deleted environments is still included in your Insights.How far back does the data go?
Currently, Insights data is available from May 16, 2025, onwards.Limitations
- Time granularity is automatically selected based on the time range and cannot be manually adjusted (e.g. it’s currently impossible to view hourly data for the last week)