Debugging Node.js applications in Theia
Gitpod is based on the open-source Theia IDE Framework, which is highly inspired by VS Code, reuses its major components like the Monaco editor and intelligent-language support and is designed to run as a web application.
At TypeFox, we use Gitpod to develop Theia and all its satellite projects, like Theia extensions and language servers. We’ve discovered that for most use cases we don’t need to go to local development anymore. Development, testing, and the review processes are streamlined, leading from source code to a proper developer environment accessible from a browser with a single click.
Up to now, there was one important use case that forced us back to local tools, because it was not supported by Gitpod: Debugging.
Now, it is available, and I would like to give you a run through the basics of Node.js debugging in Gitpod based on an example.
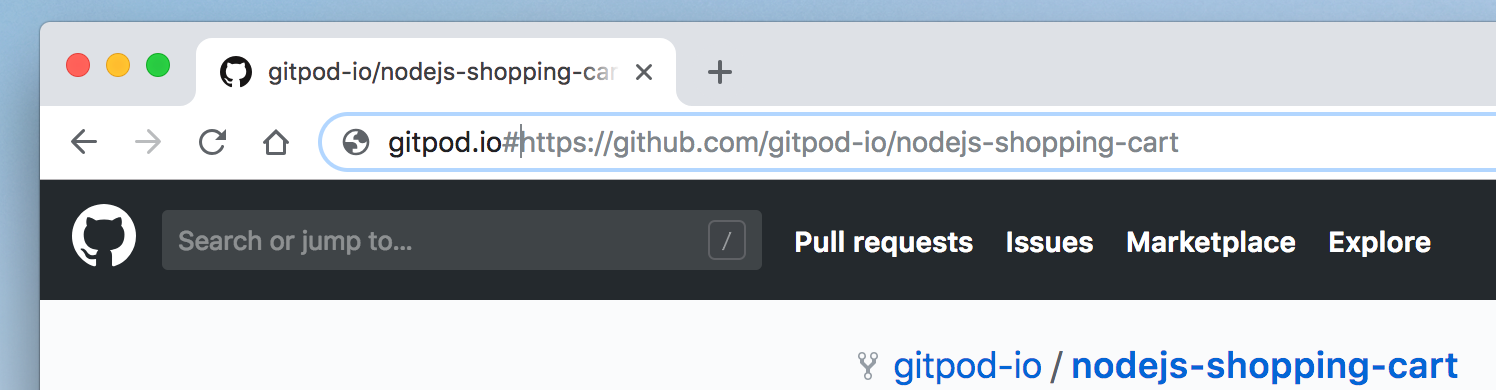
Step 0: Open Node.js Shopping Cart example in Gitpod
Start a new workspace for the example GitHub repository: https://gitpod.io/#https://github.com/gitpod-io/nodejs-shopping-cart
A new Gitpod workspace will be opened. Required dependencies are installed automatically since the repository is configured with a .gitpod.yml file. You can see it in the terminal, opened in the bottom area.
Step 1: Start debugging
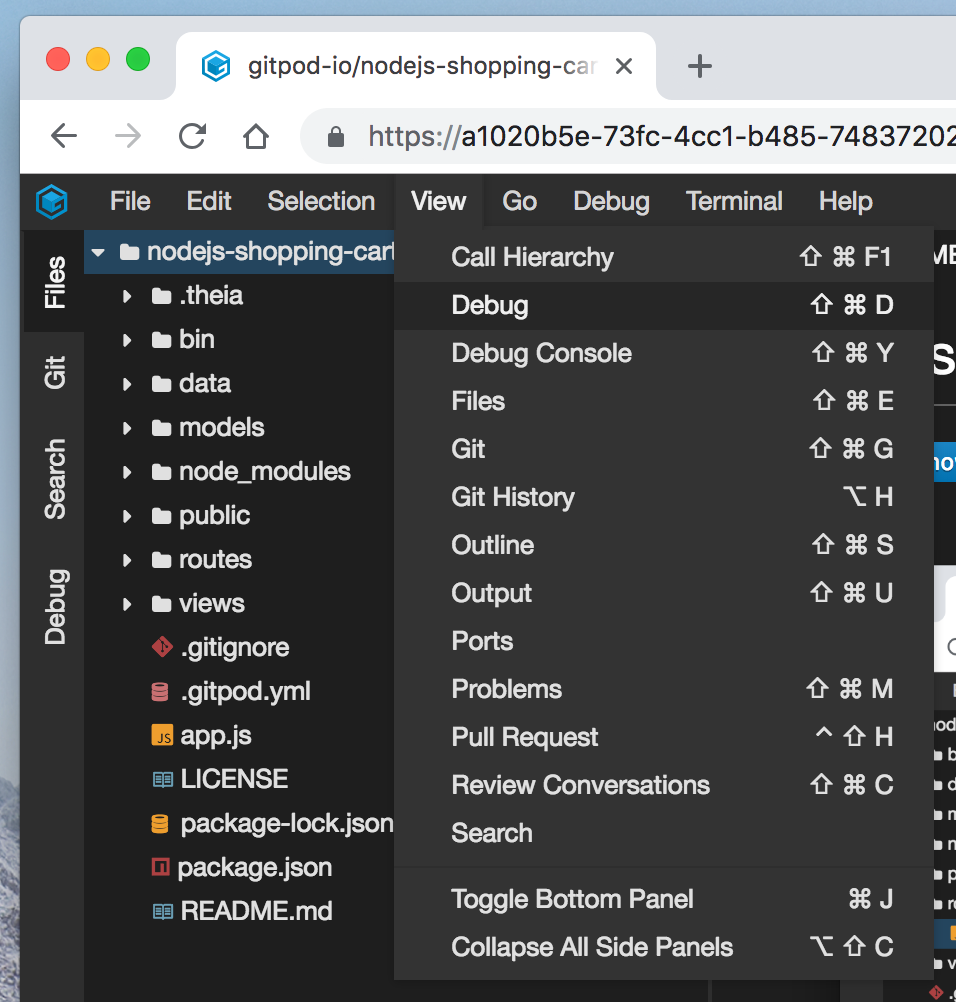
In order to start debugging, you should open the debug view first. You can do it via Viewmain menu or with Ctrl/Cmd+Shift+D.
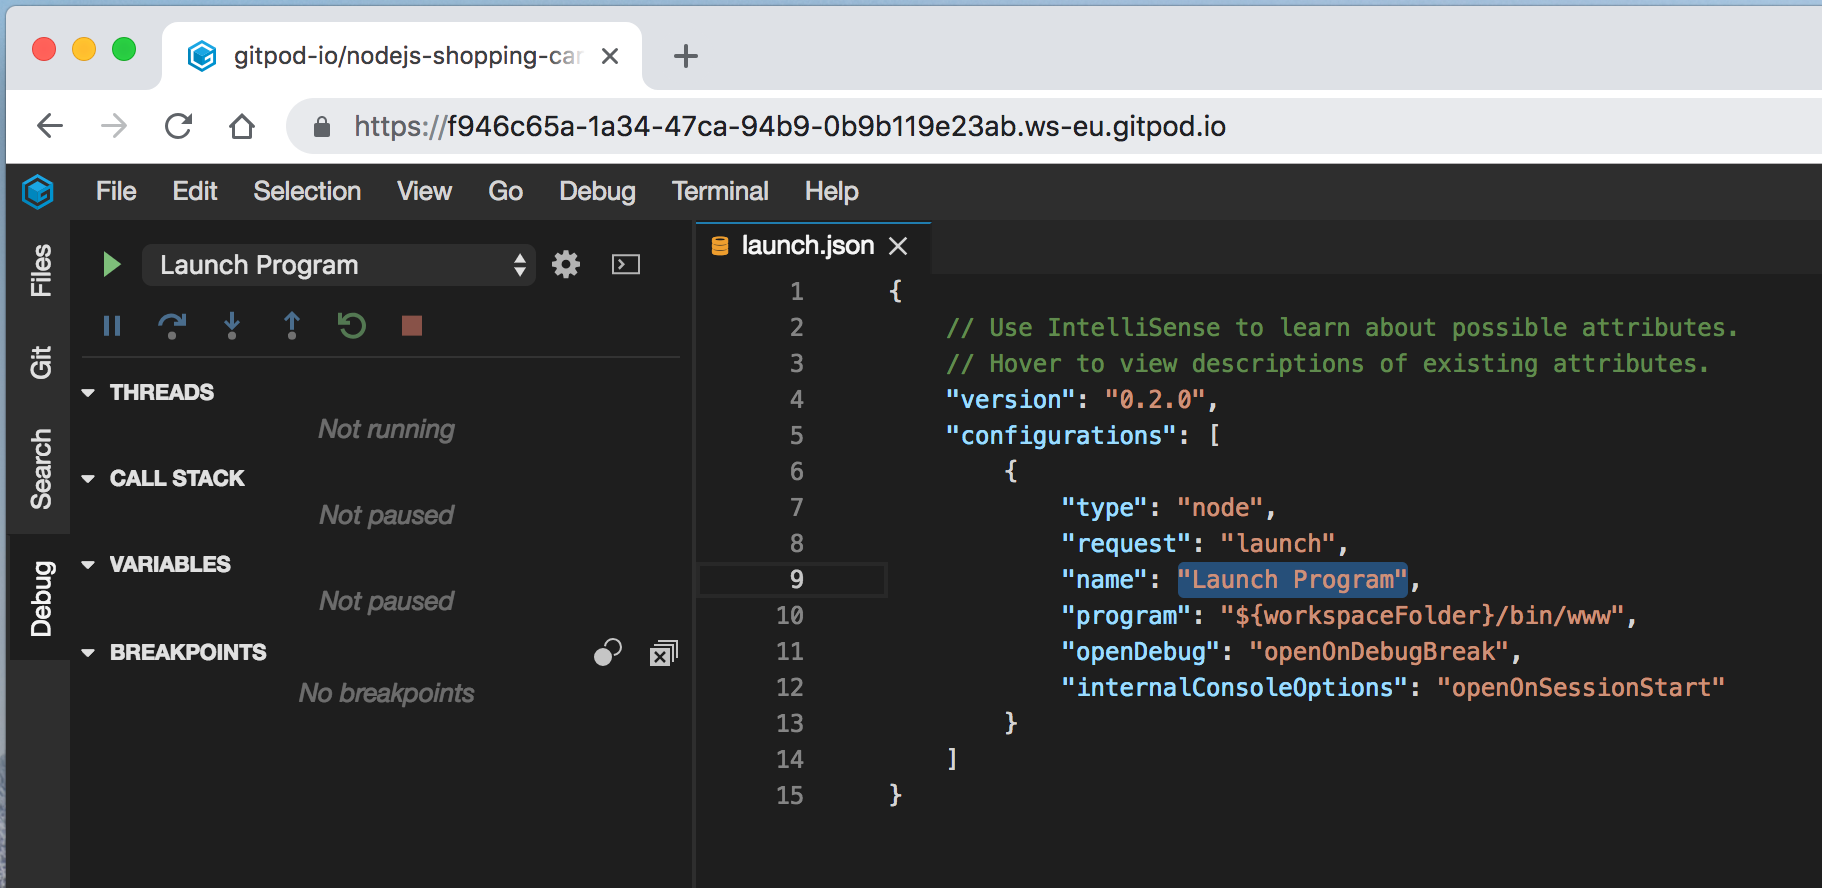
The debug view allows you to configure launch configurations, start and manage debug sessions. Configurations are persisted debugging setups. They are stored in a VS Code compatible format in a launch.json JSON-file located in your workspace’s .theia folder. If your project already has the VS Code launch file, then Gitpod will recognize and use it instead.
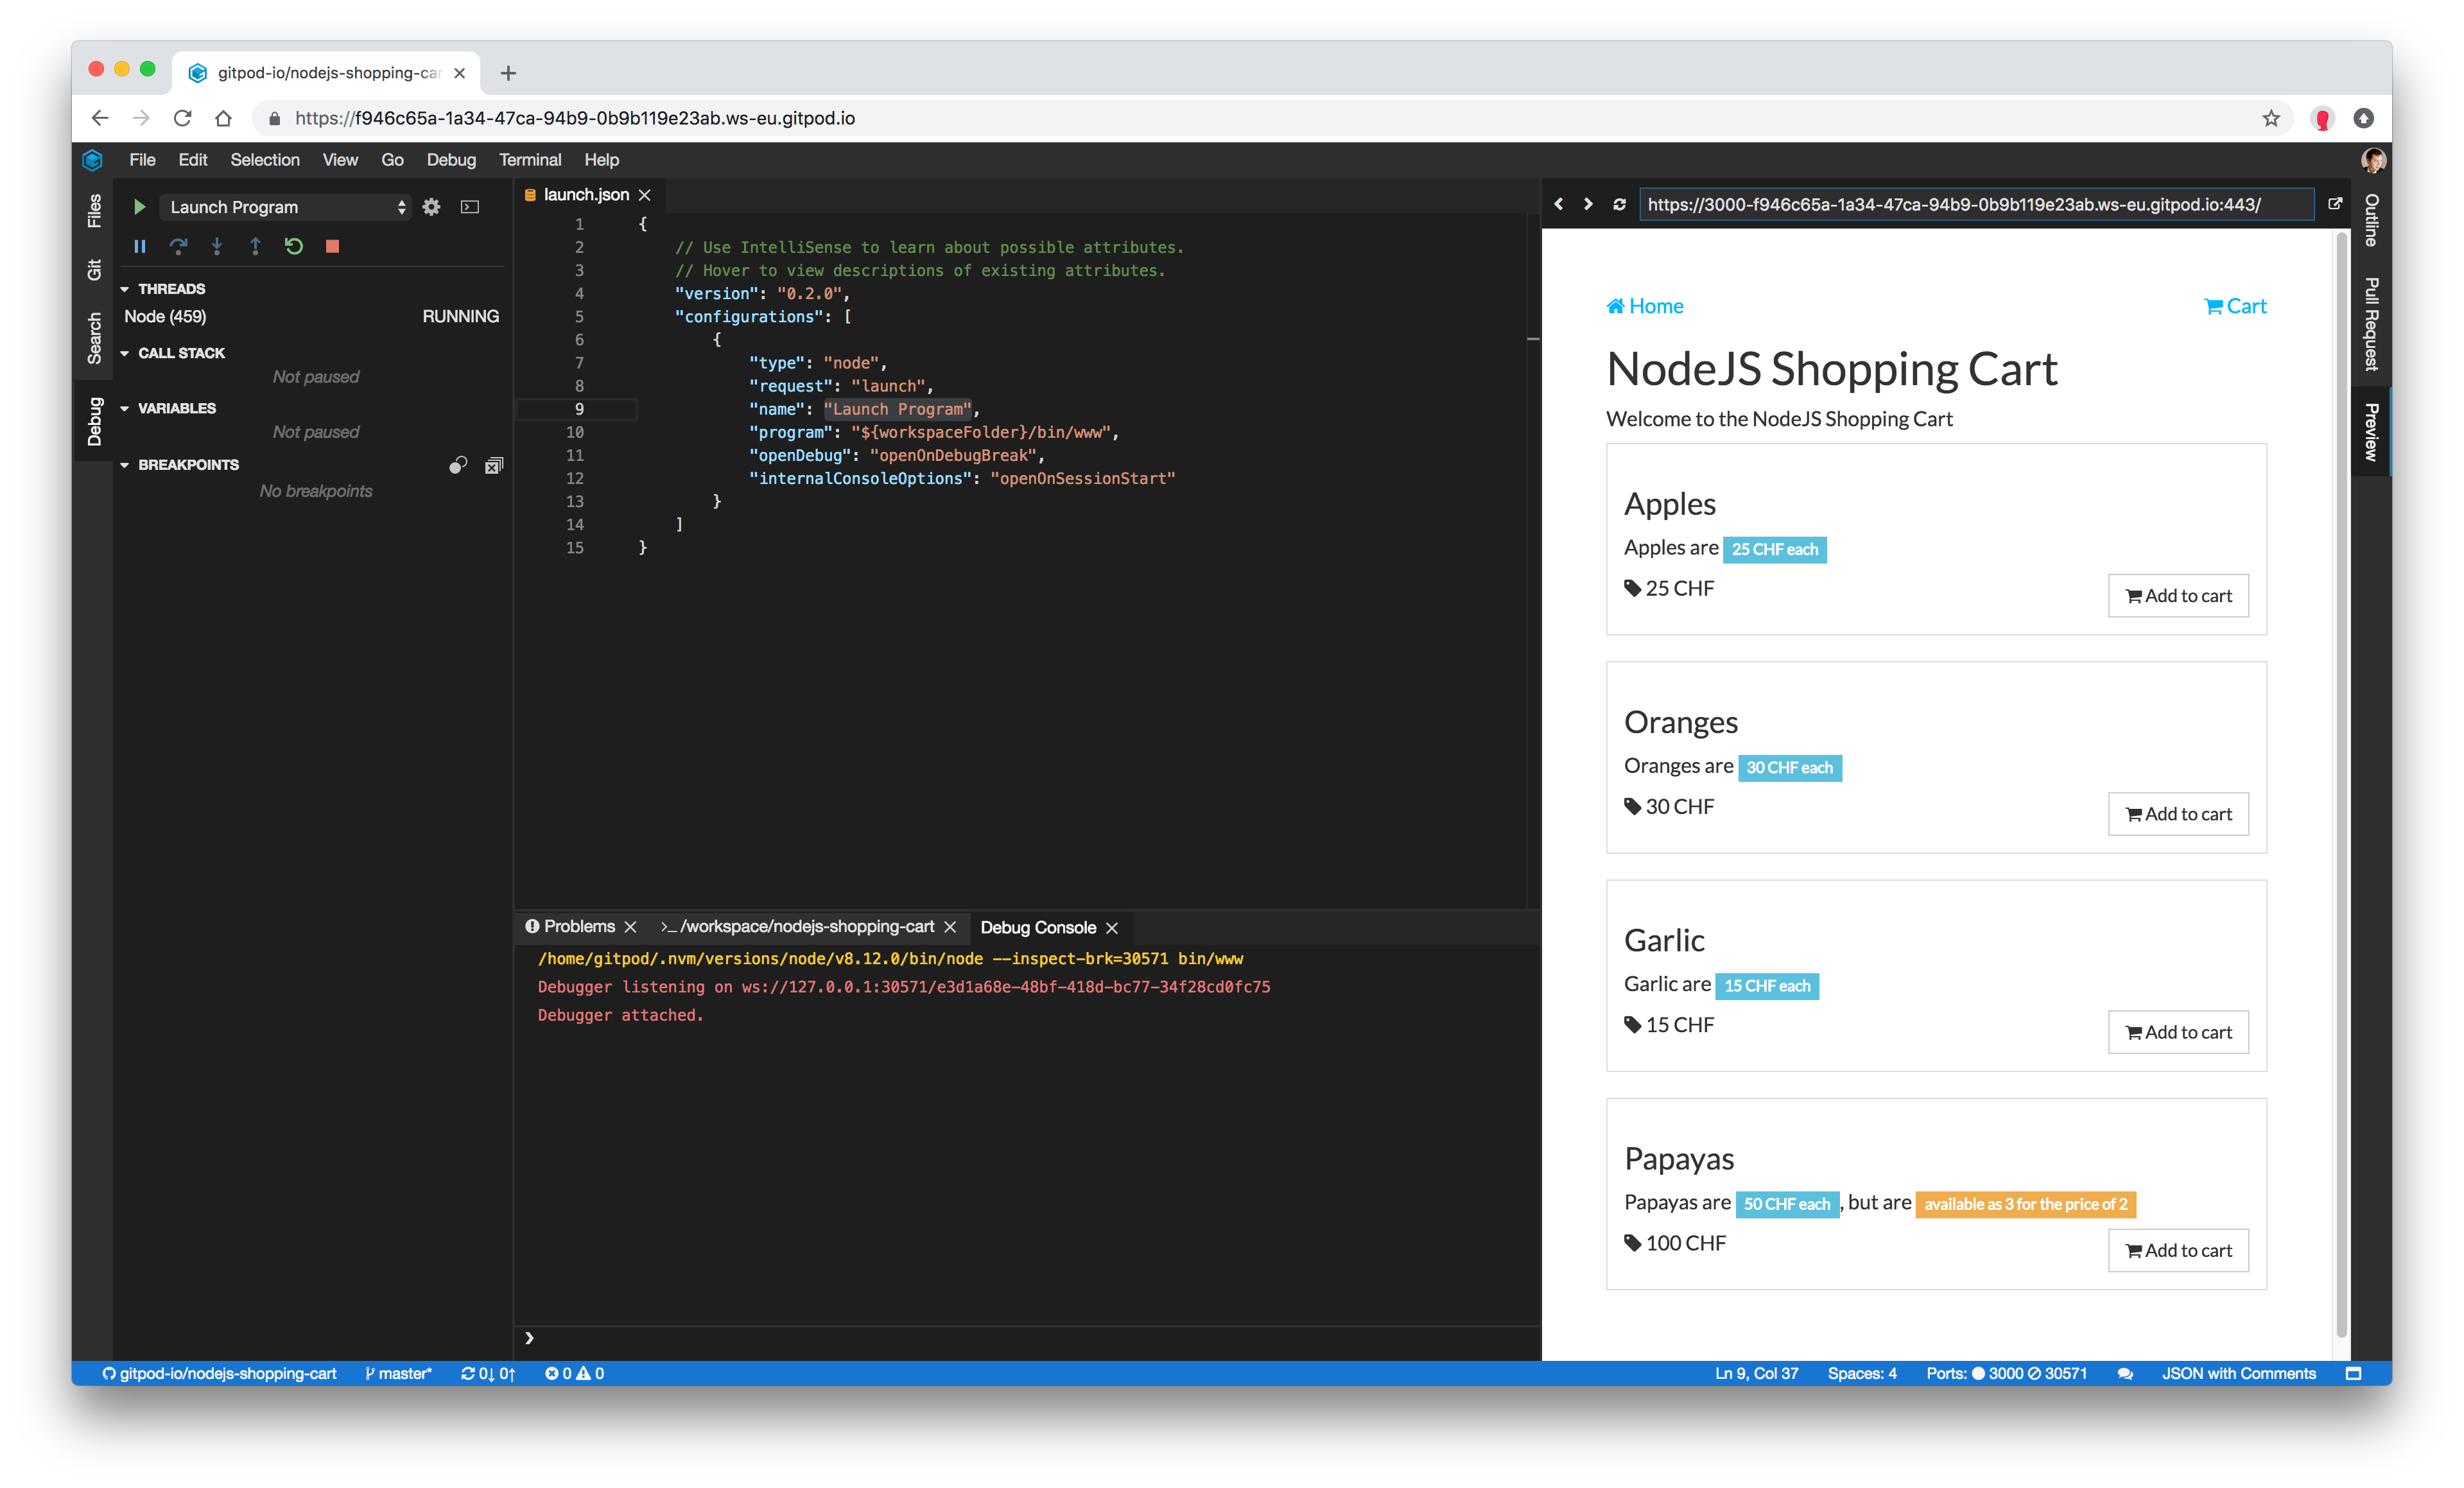
Node.js Shopping Cart is an Express.js web-application. The repository already has a pre-configured Launch Program configuration, which starts the web server Node.js process in the debug mode. Let’s run it with F5 or by pressing the run button left to the configuration drop-down.
Step 2: Preview the application
A notification should pop-up suggesting you open an application side-by-side with an editor or externally, in a new browser tab. Let’s open it side-by-side to be able to debug and use our app at the same time.

Take your time and play with the app. You can review items to buy and in your cart, move them into or out of your cart.
Step 3: Pause on a breakpoint
In this step we debug what happens when a user navigates to the homepage.
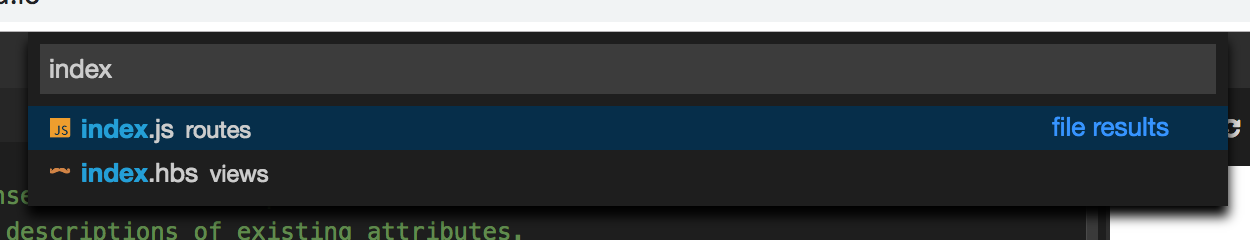
First, we need to add a breakpoint to the routing logic. It is defined in routes/index.js. You can open that file from the navigator or using the quick file palette (Ctrl/Cmd+P) .
Next, add a breakpoint in the editor margin against a line which you want to debug. A route callback handling / path looks promising.
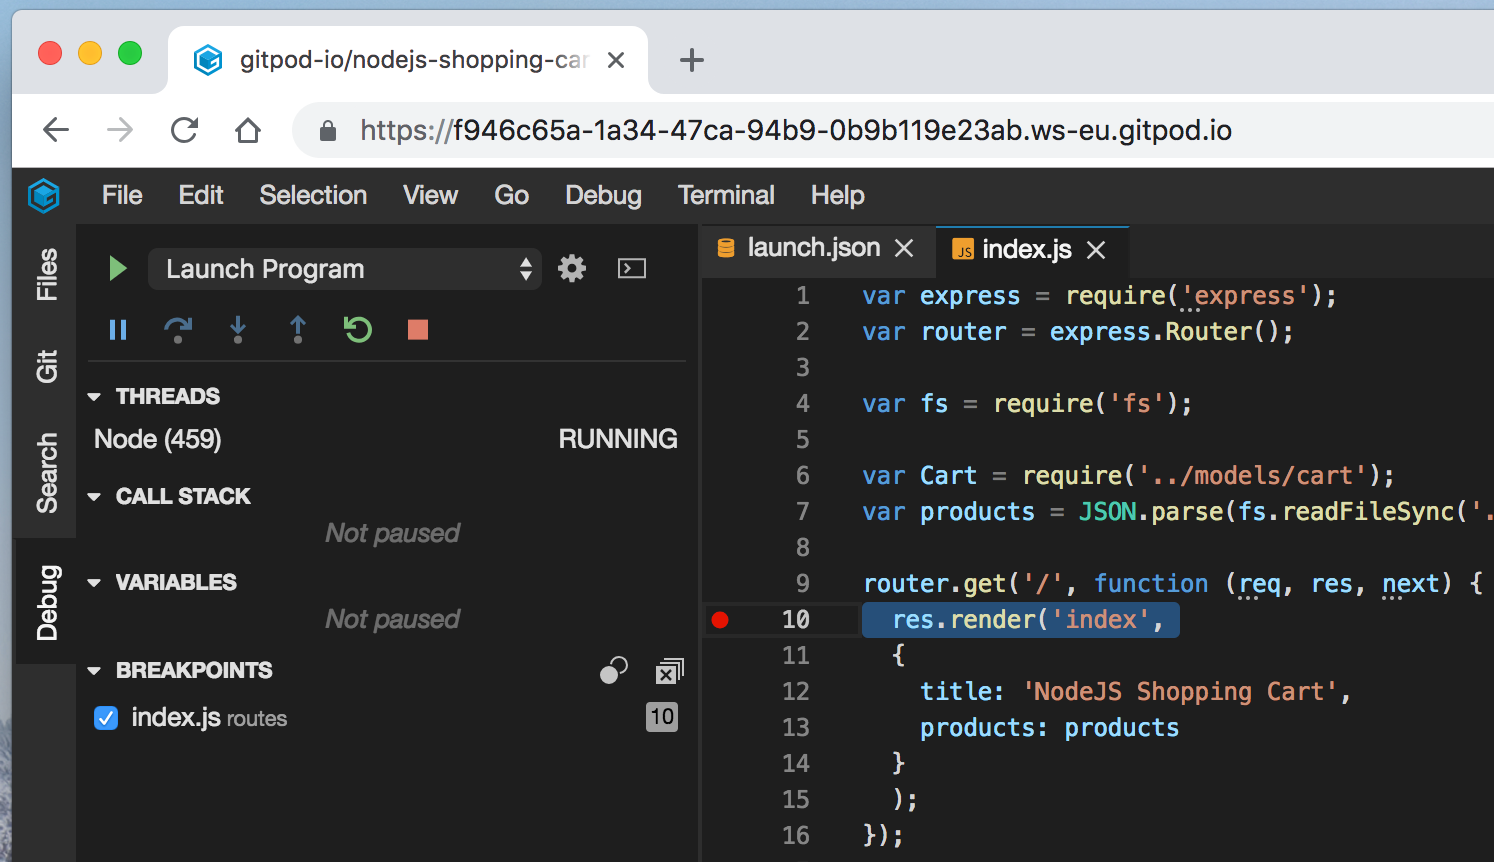 Breakpoints are displayed in the debug view and applied to currently running sessions.
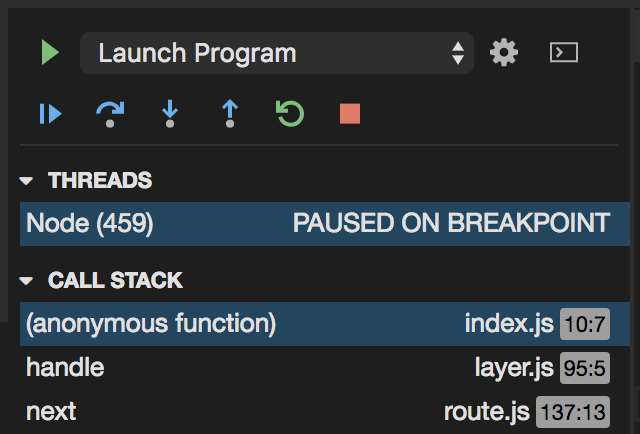
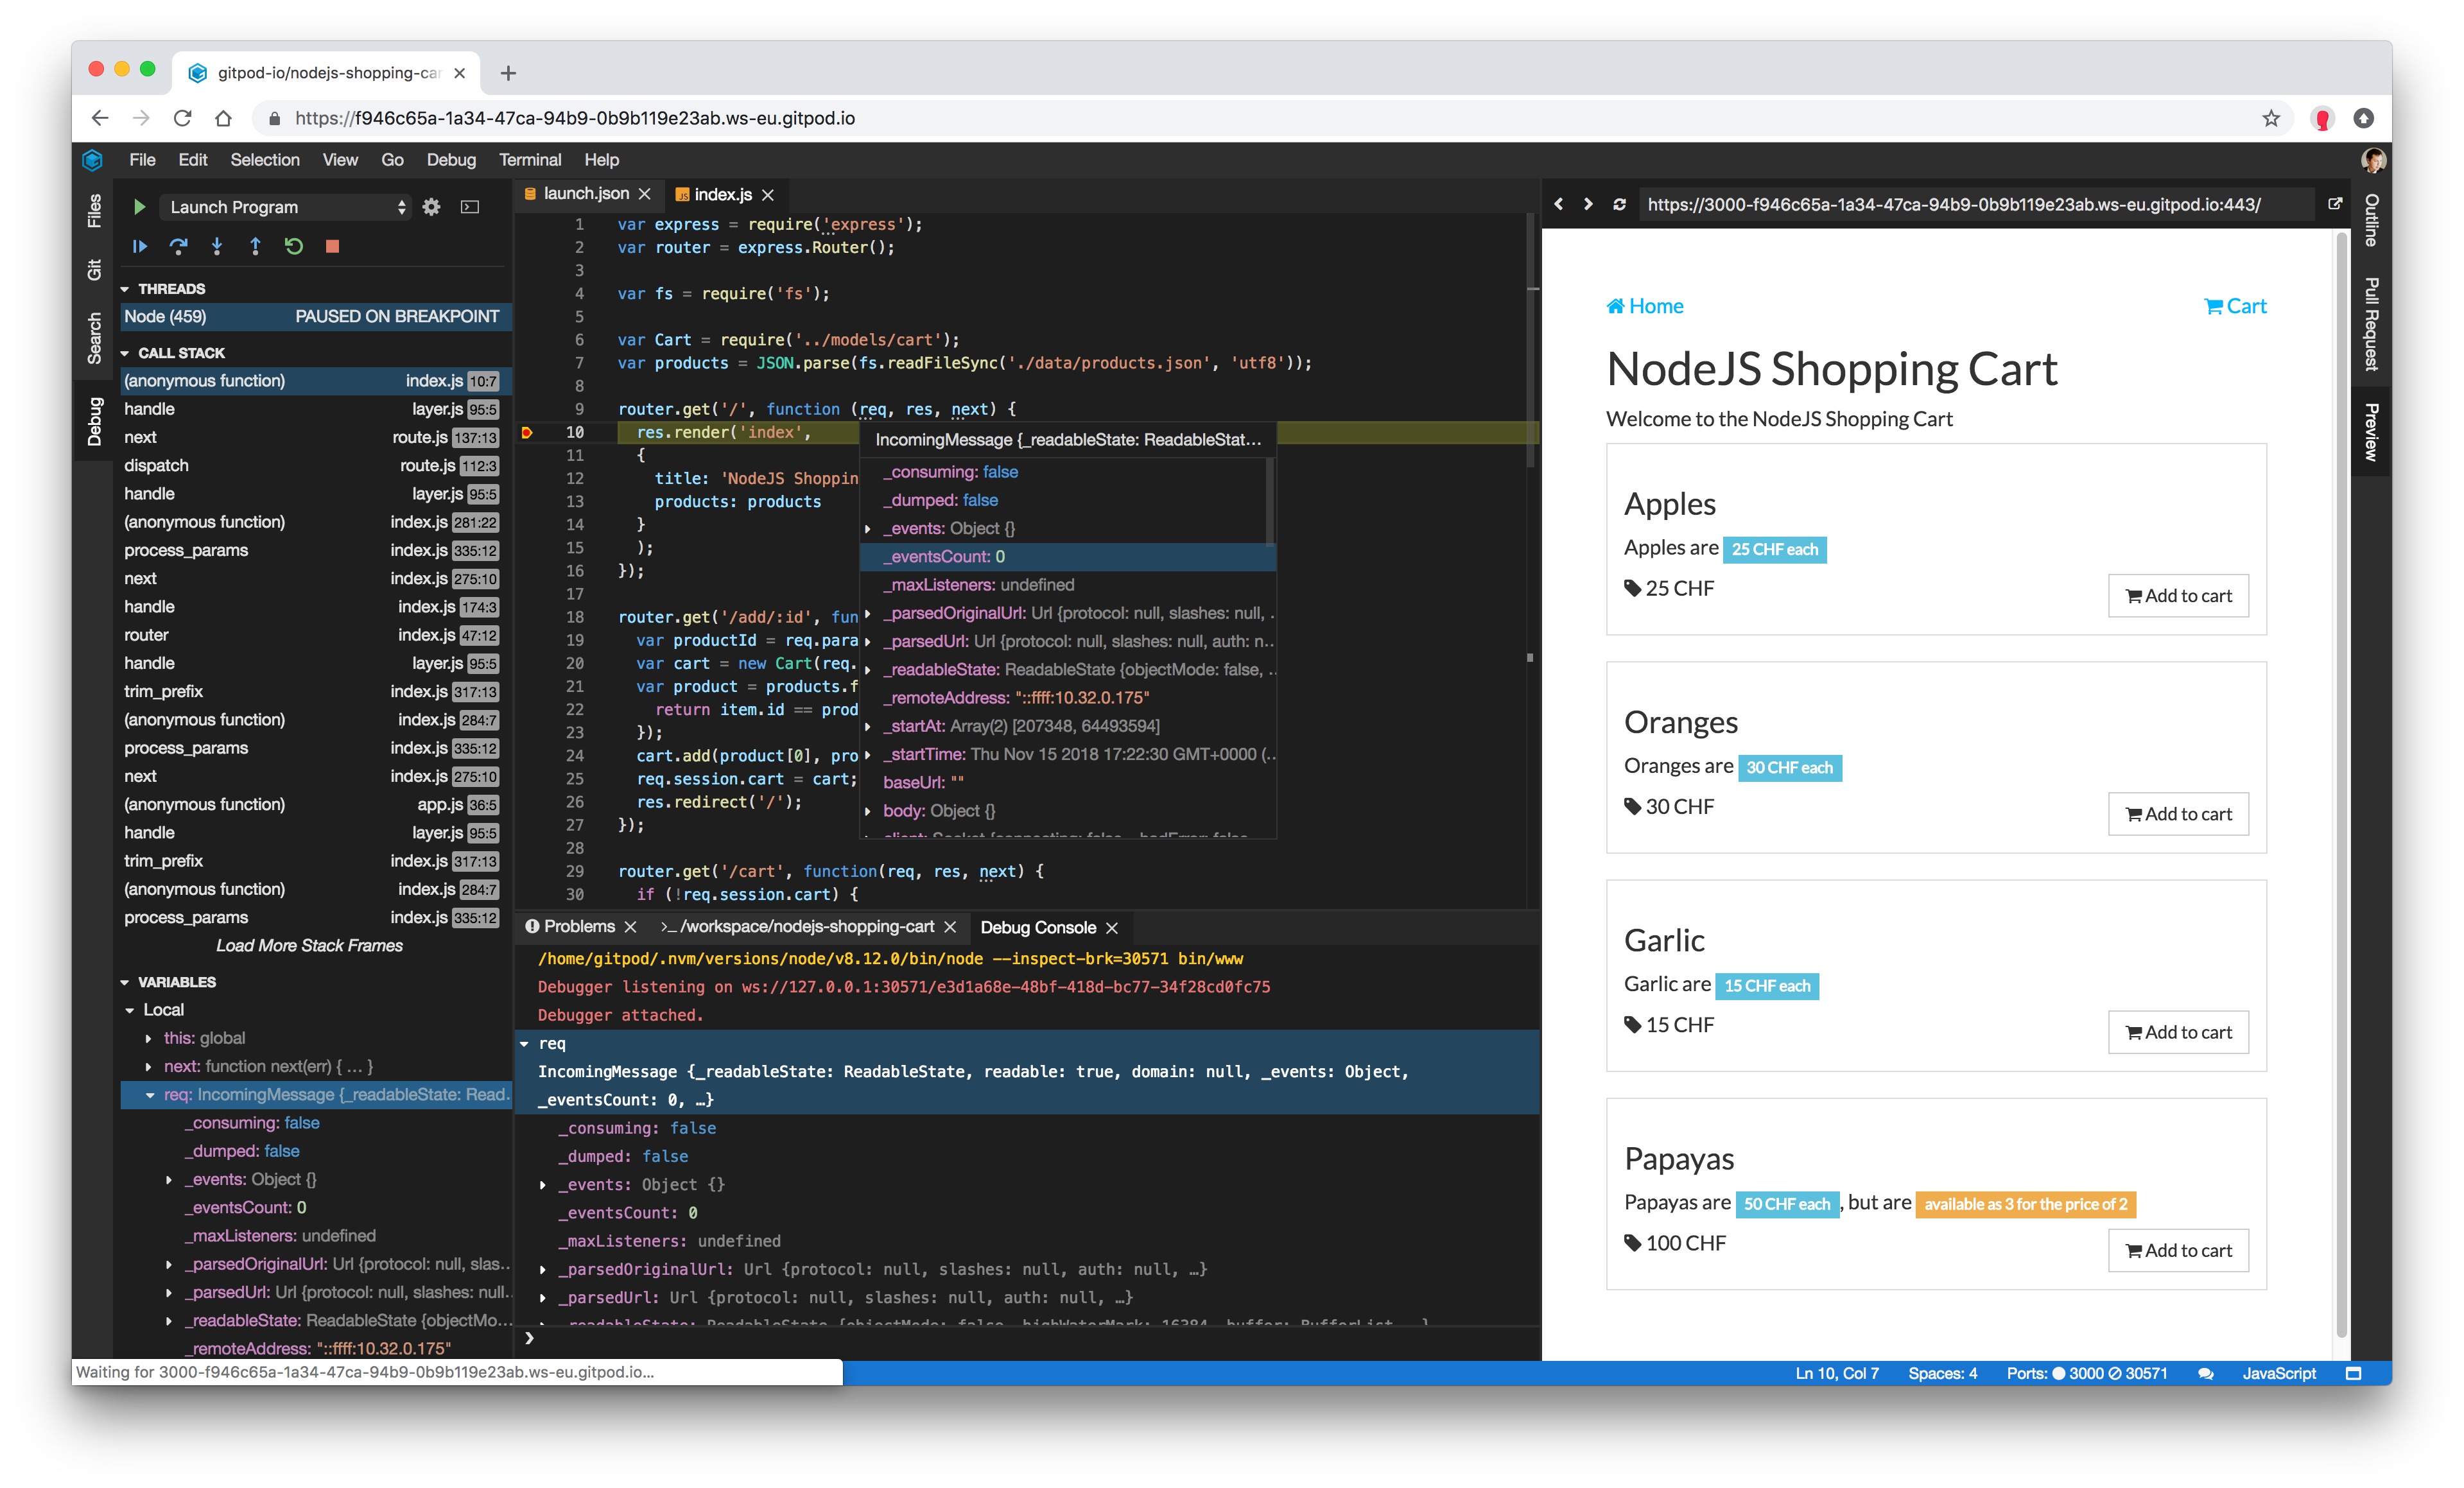
Now, in the app, try navigating to the homepage. The debug session will pause on the breakpoint. You can traverse the current stack trace, inspect variables and control the execution flow with the debug actions toolbar:
Step 4: Inspect and modify data
There are several ways to see variables’ values:
you can traverse current scopes and variables in the debug view;
you can hover over expressions in the editor to evaluate them with a current session;
or you can use the debug console (REPL) to evaluate custom expressions.
You can always double-click on any variable to modify its value.
Next steps
Debugging is an important feature to provide the complete development experience. The Node.js debugging support is the first step for Gitpod in this direction. We are working to bring more debug features and add support for more runtimes. We would also love to hear what features and runtimes you want to see supported. Tell us.
